How Do I Clean Up, Transform, and Load Data into Power BI?
Power BI is a powerful tool that allows users to create visually immersive and interactive reports within minutes. Such reports improve data-driven decisions, allow data exploration, and facilitate actionable insights.
However, you can’t achieve such results if you have just connected your sources to Power BI and started creating reports. The reason is straightforward because several columns can contain null values, errors, and duplicate data.
It can lead to incorrect results and assessments. Therefore, you need to clean, transform, and load data in Power BI to create a meaningful report. This process allows you to easily identify trends and make better choices by producing more accurate results.
It ensures tables are organized, allowing users to find data very easily. Also, it removes duplicate data and simplifies navigation.
But cleaning, transforming, and loading data in Power BI might feel challenging, as you need to identify errors, remove duplicates, and transform data into the desired format.
You might also encounter missing values, incorrect formatting, or duplicate entries. With step-by-step guidance, this process can be done with ease, allowing you to create a robust report.
We will see the step-by-step guide to clean up, transform, and load data into Power BI.
Step-by-Step Guide: Clean, Transform, and Load Data in Power BI
Getting your data to a level where you can easily visualize it can be both challenging and rewarding.
But with the right data analysis tool and data cleaning techniques, you can turn messy data into meaningful insights that can help you succeed.
So, to Clean, Transform, and Load data in Power BI, you can follow these simple steps:
Step-1: Connect to the Data Source
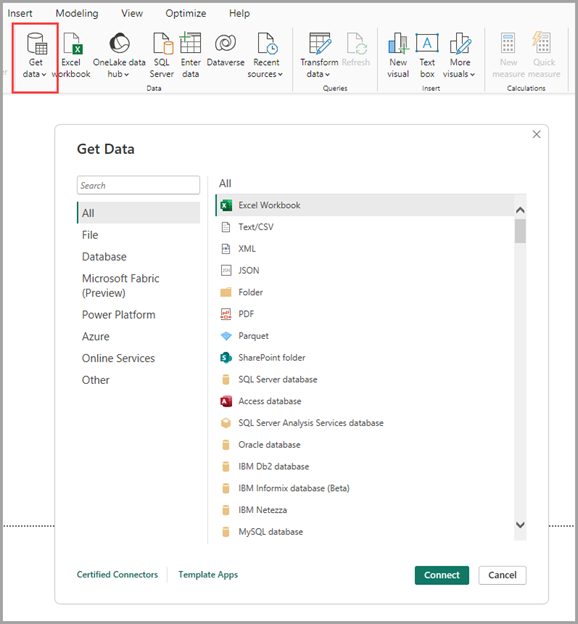
- Start by connecting to the data source to import data into Power BI.
- Open Power BI Desktop and check the available data source from Home.
- You can select the Get Data button. It will open the Common data sources list.
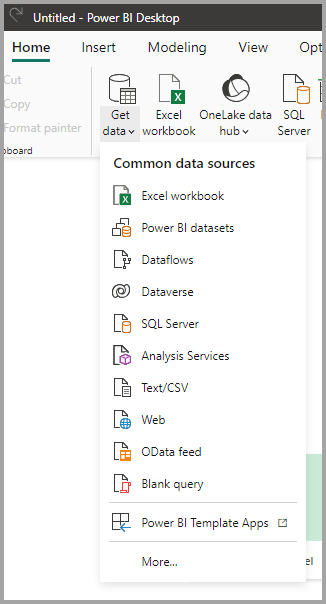
- In case your data source is not listed in Common data sources, you can click on More. It will open the Get Data dialog box.
- Or click directly on Get Data button to open Get Data dialog box
- Choose your data source, whether it's an Excel file, SQL database, or online service, and click 'Connect'.
Step-2: Clean the Data
To clean data in Power BI, you can employ a variety of tools, such as removing duplicates, filtering out irrelevant rows, and sorting data by different criteria.
Power BI offers a variety of tools to clean up messy data. This is the longest step, but with a step-by-step method, you can easily clean data.
Here is how you can clean data:
- Remove duplicates: Go to the 'Home' tab of the Power BI ribbon, select the column containing duplicate data, and click 'Remove Duplicates'.
- Handle missing values: Use 'Replace Values' or 'Remove Rows' to address missing data.
Step-3: Transform the Data
![]()
Use the Power Query Editor to transform the data into the format you need, once you’re done cleaning data in Power BI.
Click the 'Transform data' button on the Home tab of Power BI Desktop to open Power Query Editor.
Note: It is recommended to record your data-shaping or transforming steps in Power Query Editor. You can view your steps and query properties in the Query Settings pane on the right side of the screen.
The data transformation step can include:
• Identifying Column Headers and Names
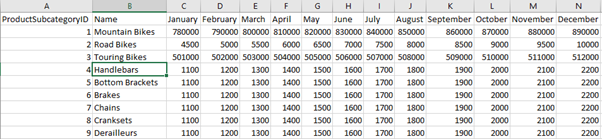
Identify column headers and names and evaluate their location for the correct position. See the screenshot below;
the source data in the Sales Target CSV file has product categories and monthly subcategories organized into columns.
• Promoting Headers
To handle the situation where a table in Power BI Desktop assumes that all data belongs in table rows, but there’s a first row containing column names like in the previous Sales Target example,
you can correct this by promoting the first table row into column headers.
There are two ways to promote headers:
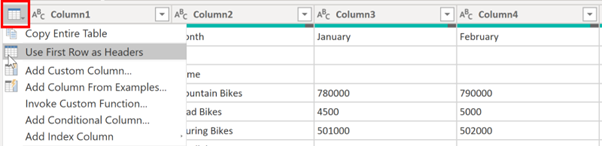
1. On the Home tab, select the "Use First Row as Headers" option.
2. Alternatively, select the drop-down button next to Column1, and choose "Use First Row as Headers".
• Renaming Columns
To examine the column headers and address potential issues such as incorrect headers, spelling errors, or inconsistent naming conventions, follow these sub-steps:
1. Refer to the previous screenshot that shows the impact of the "Use First Row as Headers" feature. Notice that the column containing subcategory Name data now has an incorrect column header, labeled as "Month".
2. To rename column headers, you have two options:
- Right-click the header, select "Rename", change the name, and press Enter.
- Double-click the column header and overwrite the name with the correct value.
3. Renaming the columns to their proper names after eliminating (skipping) the first two rows is another option.
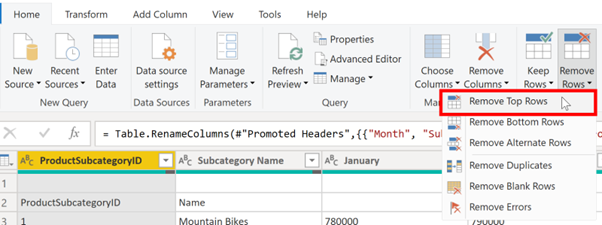
• Removing Top Rows
To remove rows from your data during the shaping process, follow these steps:
1. If you encounter top rows that are blank or contain irrelevant data for your reports, you need to remove them.
2. In the Sales Target example, see that the first row is blank, and the second row contains data that is no longer needed.
3. To remove these excess rows, go to the Home tab and select "Remove Rows" followed by "Remove Top Rows".
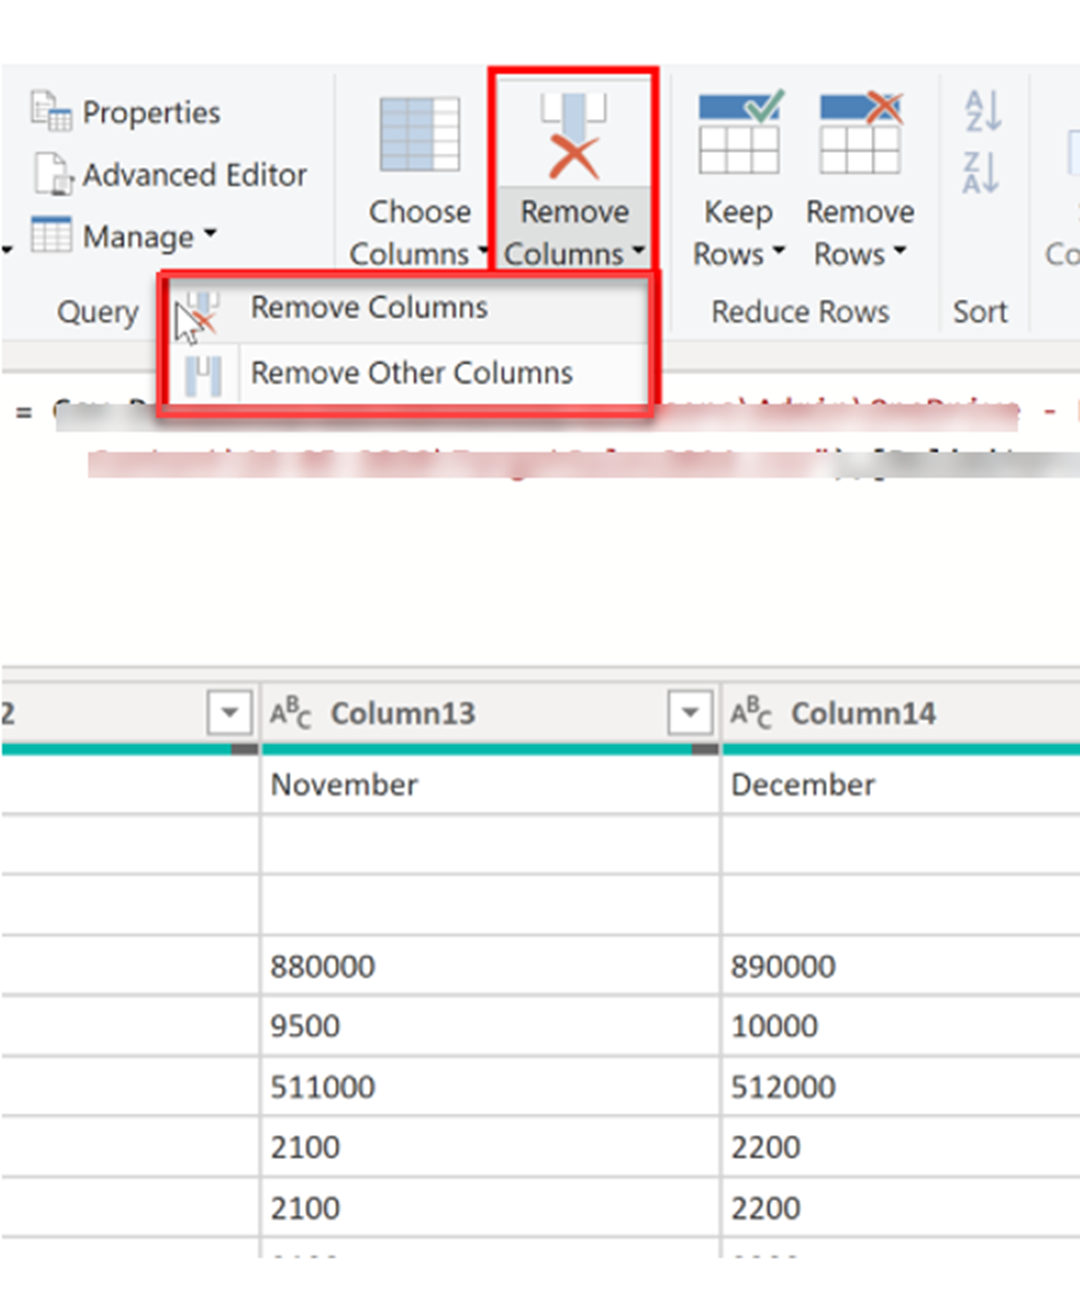
• Eliminating Columns
To remove unnecessary columns during the data shaping process, follow these steps:
1. It is ideal to remove columns as early as possible in the process, even at the data extraction stage.
For example, in SQL, you can use a column list in the SELECT statement to limit the extracted data to only needed columns when working with relational databases.
2. Removing columns early is especially important when you have proven relationships between tables.
Removing unnecessary columns allows you to focus on the essential data and improves the overall performance of your Power BI Desktop datasets and reports.
3. Examine each column and determine if the data it contains is truly needed. If a column doesn't contribute to your reports, it adds no value to your data model and should be removed.
You can always add the column back later if requirements change.
4. To remove columns, you can use either of the following methods:
- Select the columns you want to remove, then go to the Home tab and choose "Remove Columns".
• Unpivoting and Pivoting Columns
Unpivoting Columns
Unpivoting is a valuable feature in Power BI, often utilized when importing data from Excel. Initially, the data appears understandable, but making calculations across rows becomes challenging.
Your objective is to present the data in Power BI with different columns.
Unpivoting simplifies the process of creating DAX measures for the data in the future. By completing this step, you establish a more straightforward approach to slicing the data using the defined columns.
Pivoting Columns
When dealing with flat data that lacks structure or grouping, it can be challenging to identify patterns.
To address this, you can use the Pivot Column feature in Power BI to convert the flat data into a table with gathered values for each unique entry in a column.
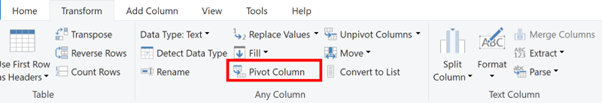
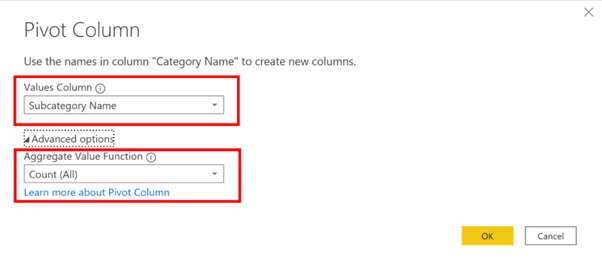
In the SalesTarget example, you can pivot the columns to determine the number of product subcategories within each product category. Here's how to do it:
1. Go to the Transform tab in Power Query Editor.
2. Select Transform > Pivot Columns.
3. In the Pivot Column window, choose a column from the Values Column list (e.g., Subcategory name).
4. Expand the advanced options and select an option from the Aggregate Value Function list (e.g., Count (All)).
5. Click OK to proceed.
Remember: Power Query Editor logs all data-cleaning steps in the Query Settings pane. Once you've made all required changes, select 'Close & Apply' to apply the modifications to your data model.
Step-4: Apply Data Modeling
In Power BI, you can create data relationships between different tables, create hierarchies, and define measures, which are calculated values used in charts and tables.

Step-5: Load data into Power BI
Once you have cleaned, transformed, and modeled your data, you can load it into Power BI.
From there, you can create visualizations:
• Bar charts to show top-selling products.
• Line graphs to illustrate sales trends over time.
• Maps display regional sales performance.
How Can Dynamics Square Help?
Cleaning, transforming, and loading data in Power BI help you transform your raw data into insightful visualizations with accurate results, deriving better decisions.
However, you need to master these steps, which might be time-consuming and challenging.
Hence, Dynamics Square, a leading Microsoft Dynamics 365 Partner, empowers you with 135+ certified, well-versed consultants. Our team is available 24/7 to resolve your query about cleaning, transforming, and loading.
We have been offering our service for 14+ years, which makes us competent to answer your queries and help you create accurate reports.
In this duration, we have served more than 350+ clients globally. We also offer free consultation call to answer your questions and get your business process back on track.
Reach out to our consultants at +1 778 381 5388 or draft an email at info@dynamicssquare.ca to create immersive and accurate results!
People Also Ask:
Why is it necessary to perform Data Cleaning in Power BI?
Data cleaning in Power BI is essential to ensure accurate and reliable analysis by addressing issues such as missing values, duplicates, inconsistencies, and formatting errors that can hurt data quality and analytical results.
What is used to clean and transform data in Power BI?
Power Query Editor is used in Power BI to clean and transform data, providing functionalities to shape, filter, merge, and manipulate data from various sources before loading it into the data model for analysis.
How do you load data in Power BI after transformation?
After transforming the data in Power Query Editor, you can load it into Power BI by selecting "Close & Apply".
This action applies the changes made in Power Query Editor and loads the data into the data model for further analysis and visualization in Power BI.
How do I cleanse data in Power BI?
You can cleanse data using data cleaning techniques in Power BI, such as handling missing values, removing duplicates, correcting inconsistencies, standardizing formats, and applying data validation rules.
These cleansing tasks can be performed in the Power Query Editor by utilizing its robust set of data transformation and cleaning capabilities.
Do you load or transform data in Power BI? What's the difference?
In Power BI, you both load and transform data. Loading data refers to bringing the data from a source (such as a database or file) into Power BI for analysis.
Transforming data involves manipulating and shaping the loaded data using Power Query Editor to clean, filter, merge, aggregate, and derive new insights before visualizing and analyzing it in Power BI.
The difference between load and transform data is that loading brings data into Power BI, while transforming involves changing and preparing the data for analysis.
What is data cleaning in Power BI?
Data cleaning in Power BI refers to removing errors, inconsistencies, duplicate, incomplete, and missing data. The goal of data cleaning is to ensure that data is accurate, complete, and reliable when multiple data sources are connected.
How to transform data in Power BI?
There are two ways to transform data in Power BI: Power Query Editor or Power Query Formula Language. First, connect your data source to Power BI.
Select the dataset you want to transform in the Power Query Editor. Apply the transformation, such as sorting, filtering, and removing to transform the data.
How to make Power BI load faster?
If you are using a large data set, your Power BI dashboard might take longer to load. Apart from data, more visuals can also increase the loading time. Follow these steps to make Power BI load faster.
- • Try to use less visualization.
- • Optimize the used visuals.
- • Usage of multiple features can hinder the loading speed.
.png)
Samar Malik is a senior SaaS writer with an experience of 7+ years. With a list of numerous posts ranking on SERP, he is working with the sole motto of making SaaS technology more human. His deep knowledge of technology and engaging writing style shed light on its complexities, helping readers worldwide gain a deeper understanding.